
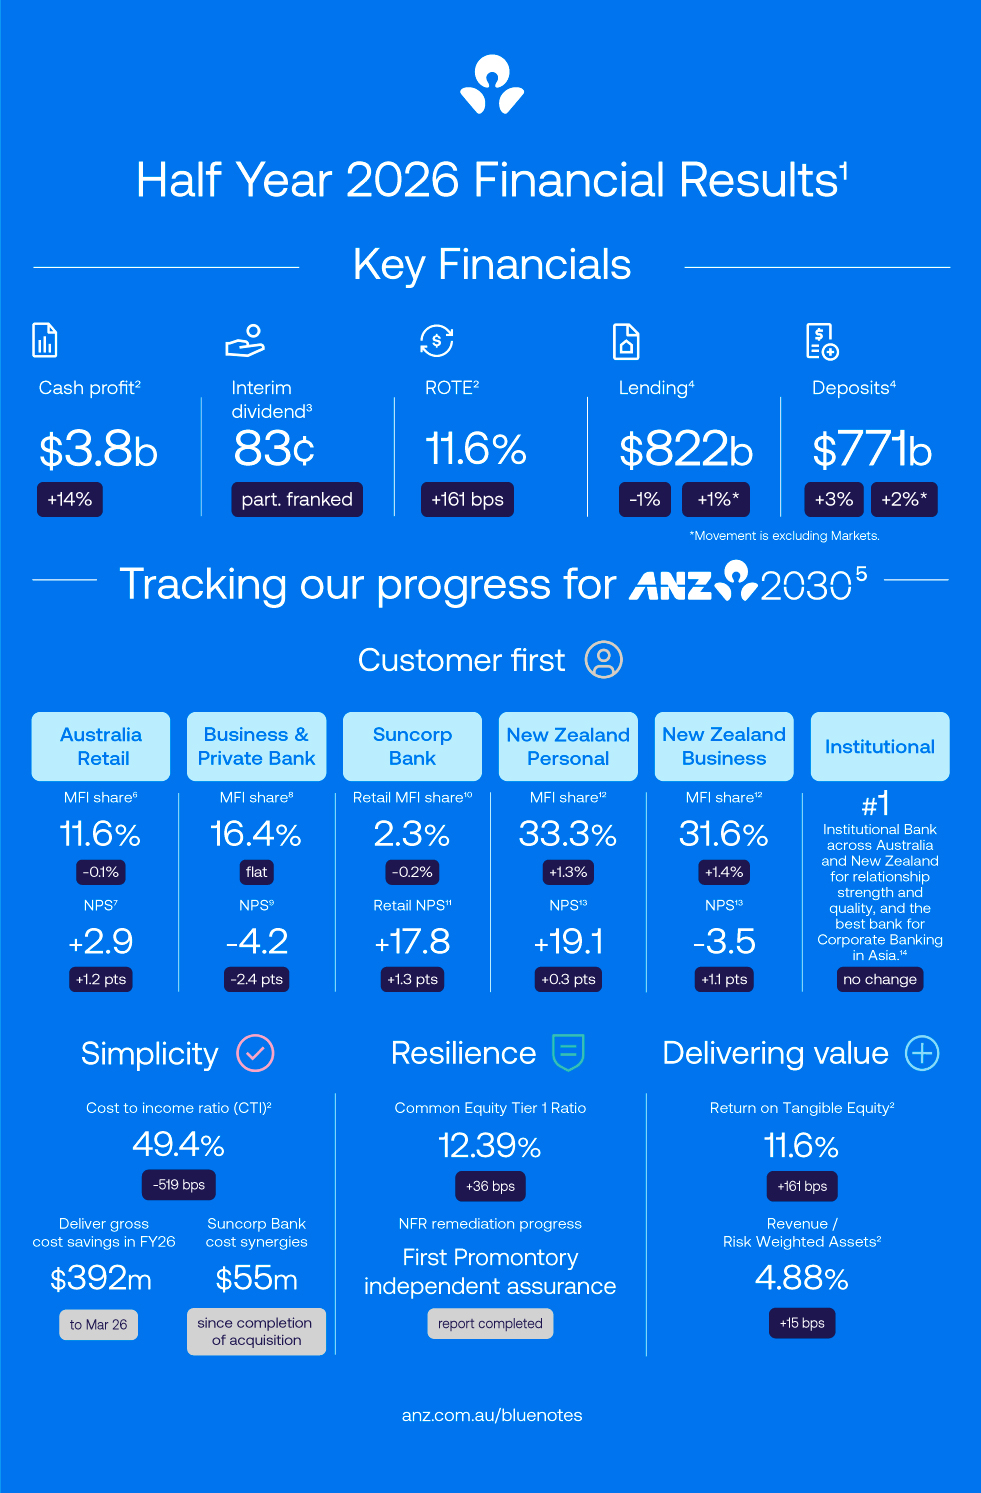
ANZ has released its half year 2026 results. The snapshot below highlights some of our key financial outcomes from the investor presentation delivered by Nuno Matos and Farhan Faruqui.
The infographic also includes Key Performance Indicators we continue to track under our ANZ 2030 strategy, aligned with our four strategic pillars; Customer first, Simplicity, Resilience and Delivering value.
Our half year cash profit of $3.78 billion was up 14 per cent on the previous half, when excluding significant items.
Dividends were maintained at 83 cents per share, and the franking rate increased from 70 per cent to 75 per cent.
To hear more, watch Nuno in conversation with bluenotes Senior Writer, Alicia Muling here.
Infographic
Click here for a printable version
Cameron Davis is Executive Manager, Investor Relations, ANZ
1. Key Financials compared to the half year ended Sep-25. Cash Profit excludes non-core items included in statutory profit outlined in the 1H26 ANZGHL Results Announcement.
2. Excluding significant items in 2H25 results outlined on page 12 of the 1H26 ANZGHL Results Announcement
3. Interim Dividend of 83 cents partially franked at 75%
4. Lending represents total Net Loans and Advances; Deposits represents total Customer Deposits
5. Movement is Mar-26 vs Sep-25
6. Source: Roy Morgan Single Source, Aged 14+, 12 months to March 2026. ANZ includes ANZ Plus. MFI relationship is based on who consumers perceive to be their main bank.
7. Source: Consumer Atlas - RFI Global. Using a scale of 0-10, customers are asked how likely they are to recommend their Main Financial Institution (MFI) to a friend or colleague. Net Promoter Score = % Promoters (score 9-10) - % Detractors (score 0-6). *"Net Promoter®, NPS®, NPS Prism®, and the NPS-related emoticons are registered trademarks of Bain & Company, Inc., NICE Systems, Inc., and Fred Reichheld. Net Promoter ScoreSM and Net Promoter SystemSM are service marks of Bain & Company, Inc., NICE Systems, Inc., and Fred Reichheld.”
8. Source: Business Atlas - RFI Global. Covers Business/Commercial customers (except Private Bank) with annual turnover <$100M. MFI relationship is based on who consumers perceive to be their main bank.
9. Source: Business Atlas - RFI Global. RFI Global – Atlas. Covers Business Banking customers (except Private Bank) with annual turnover <$100m. NPS data weighted to 47.25% SME Portfolio (which includes businesses with <$5m turnover), 32.75% SME Relationship Managed (which includes businesses with $5m - $30m turnover) and 20.00% Specialist Industries (which includes businesses with <$100m turnover). NPS results are shown as a six-month moving average. *"Net Promoter®, NPS®, NPS Prism®, and the NPS-related emoticons are registered trademarks of Bain & Company, Inc., NICE Systems, Inc., and Fred Reichheld. Net Promoter ScoreSM and Net Promoter SystemSM are service marks of Bain & Company, Inc., NICE Systems, Inc., and Fred Reichheld”.
10. Source: Roy Morgan Single Source, Aged 14+, 12 months to March 2026. MFI relationship is based on who consumers perceive to be their main bank.
11. Source: Consumer Atlas - RFI Global. Based on all 18+ survey respondents that nominate Suncorp Bank as their MFI and hold deposit, lending or card products with Suncorp Bank. Reported as six month moving average.
12. Source: Personal MFI - Insights HQ Retail Market Monitor (RMM) 6 month rolling data, sample size: 1125 a month, customers are asked “Which of these is your main provider of financial services?”; Business MFI - Business Finance Monitor (BFM) - Kantar BFM weighted 4 quarter rolling average across different business segments. Sample size is 2175 per quarter, customers are asked “Who would you regard as your business’s/organisation's main bank?”
13. Source: Insights HQ Retail Market Monitor (RMM) and Business Finance Monitor (BFM). Net Promoter Score = % Promoters (score 9-10) - % Detractors (score 0-6). *"Net Promoter®, NPS®, NPS Prism®, and the NPS-related emoticons are registered trademarks of Bain & Company, Inc., NICE Systems, Inc., and Fred Reichheld. Net Promoter ScoreSM and Net Promoter SystemSM are service marks of Bain & Company, Inc., NICE Systems, Inc., and Fred Reichheld.”
14. No.1 Relationship Strength Index in the Coalition Greenwich Voice of Client 2025 Australia Large Corporate Relationship Banking Study and Coalition Greenwich Voice of Client 2025 NZ Large Corporate Relationship Banking Study. Best Bank for Corporate Banking in Asia in the Coalition Greenwich Voice of Client 2025 Asian Corporate Banking Study.
Important Information
References to “ANZ” and “ANZ Group” are to ANZ Group Holdings Limited ABN 16 659 510 791 and its controlled entities.
This document contains general background information about the activities of the ANZ Group current as at 30 April 2026. It is information given in summary form and does not purport to be complete.
It is not intended to be and should not be relied upon as advice to investors or potential investors, and does not take into account the investment objectives, financial situation or needs of any particular investor. These should be considered, with or without professional advice, when deciding if an investment is appropriate.
This document may contain certain forward-looking statements or opinions including statements regarding our intent, belief or current expectations with respect to the ANZ Group’s business operations, market conditions, results of operations and financial condition, capital adequacy, sustainability objectives or targets, specific provisions and risk management practices. These matters are subject to risks and uncertainties that could cause the actual results and financial position of the ANZ Group to differ materially from the information presented herein. When used in this document, the words ‘guidance’, ‘forecast’, ‘estimate’, 'goal', 'target', 'indicator', 'plan', 'pathway', ‘ambition’, ‘modelling’, ‘project’, ‘intend’, ‘anticipate’, ‘believe’, ‘expect’, ‘may’, ‘probability’, ‘risk’, ‘will’, ‘seek’, ‘would’, ‘could’, ‘should’ and similar expressions, as they relate to the ANZ Group and its management, are intended to identify forward-looking statements or opinions. Forward-looking statements or opinions may also be otherwise included in this document, including by the use of footnotes. Those statements, including in respect of ANZ’s 2030 Strategy, immediate priorities and financial targets, are not guarantees or predictors of future performance, and may be affected by inaccurate assumptions or unknown risks and uncertainties or other factors, many of which are beyond the control of the ANZ Group or may not be known to the ANZ Group at the time of the preparation of this content, such as instability in global economic conditions, external exchange rates, competition in the markets in which the ANZ Group will operate, and the regulatory environment. Each of these statements and related actions is also subject to a range of assumptions and contingencies, including the actions of third parties, interdependencies between strategic and regulatory programs of work, management decisions, execution risk, and are based on corporate plans that are subject to change and may vary materially as plans continue to be developed. As such, these statements should not be relied upon when making investment decisions.
There can be no assurance that actual outcomes will not differ materially from any forward-looking statements or opinions contained herein.
The forward-looking statements or opinions only speak as at 30 April 2026 and no representation is made as to their correctness after this date. No member of the ANZ Group undertakes to publicly release the result of any revisions to these statements to reflect events or circumstances after this date.
Financial information in this document is presented on a cash profit basis unless otherwise stated. Cash profit, a non-IFRS measure, represents the Group’s preferred measure of the result of its core business activities, enabling readers to assess Group and divisional performance against prior periods and against peer institutions. To calculate cash profit, the Group excludes non-core items from statutory profit (refer to pages 69 to 71 of ANZ Group Holdings Limited First Half 31 March 2026 Consolidated Financial Report Dividend Announcement and Appendix 4D for analysis of the adjustments between statutory profit and cash profit and Definitions on pages 127 to 130 for further information).
All amounts in this document are in Australian dollars unless otherwise stated. Sum of parts within charts and commentary may not equal totals due to rounding.